
Learn how to navigate through the types of analytics we provide per the Insights Dashboard.
For each channel and video, Firework collates relevant data points to provide you insights on how your channel and videos are performing.
In the Firework Business Portal, select the channel that you want to view data for, and then select the Insights tab at the top left of your channel view.

Overview
In order to view the below revenue metrics, you will need to implement Firework tracking.
This is the first tab that opens up by default when the user clicks on the Insight section.
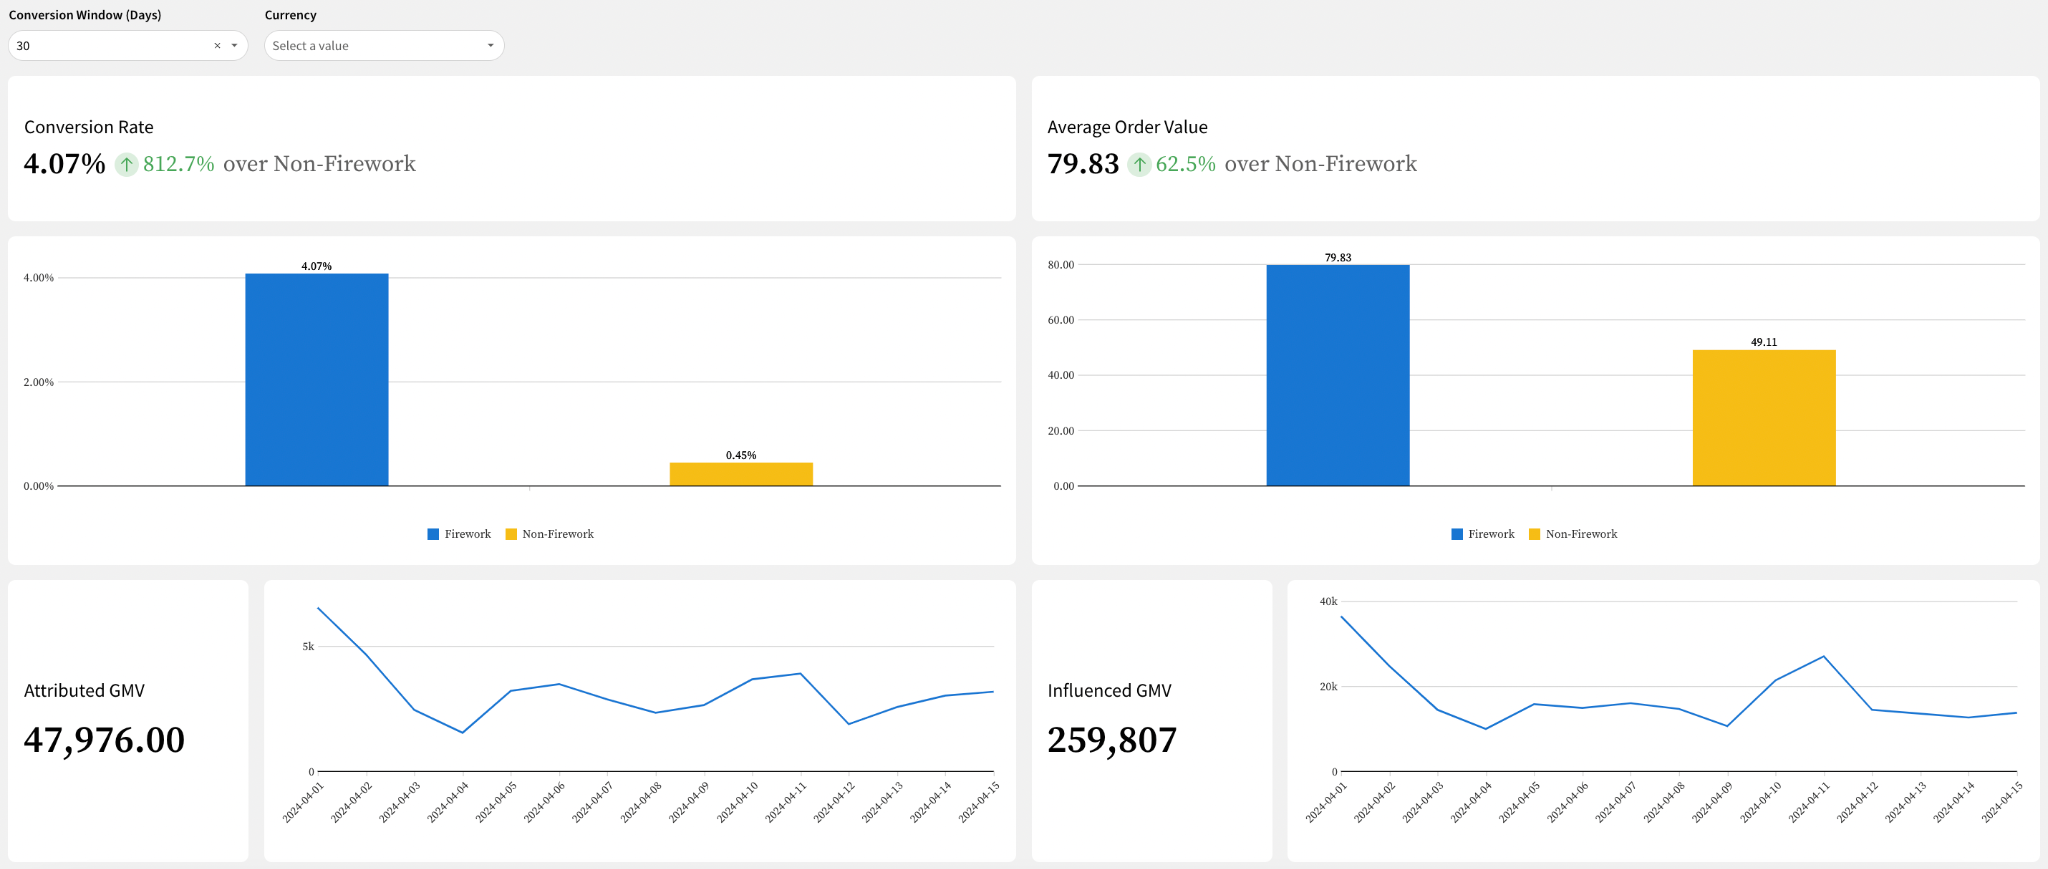
The Overview tab offers valuable insights into the total Attributed GMV and Influenced GMV generated through Firework. It also highlights the impact on Conversion Rate and Average Order Value, particularly emphasizing the uplift when compared to Non-Firework visitors along with the bar chart representation of the data.
Similarly, you can also access the Revenue data for Livestreams and Short videos.
Short Video

The Short Video tab showcases the performances of short videos and also offers the ability to click on each for detailed performance insights.
Individual Short video data
Select the video you wish to analyze and click on the Insights option. Then, choose your desired date range to evaluate the video's performance.

Playlist

The Playlist tab displays all your playlists along with the number of videos . By clicking on each playlist, you can access detailed insights into their performances.
Live Stream

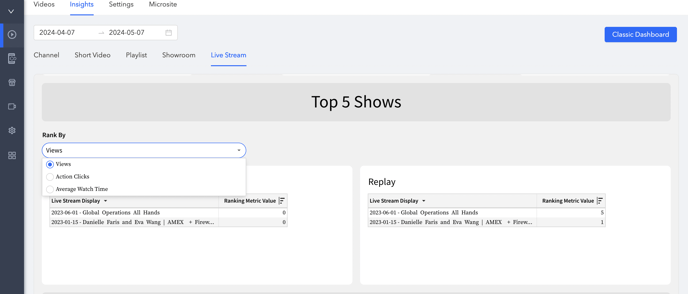
The Live Stream tab will display all of your live streams and their performances. For the Top 5 shows you can select the drop-down menu to Rank by Views, Action clicks, Avg watch time for both Live and Replay.
You can explore the audience breakdown of total views by selecting Live, Replay, or Overall data in the Audience section.
Individual Livestream Data
Click on the Individual Livestream and select Insights.
If you are looking to see large sets of performance data across your livestreams, scroll down to the section "Data Table for Export".
For a detailed list of analytics and definitions, please view our Firework Performance Metrics