In order to view the following metrics, you must have our Firework Tracking tag implemented. Please follow the instructions here if you have not done so.
Viewing One-to-One Virtual Shopping Performance Metrics
- First, navigate to the Insights section within the 1:1 Video Chat workspace in the Business Portal. We have four types of report views to choose from General metrics, Request Metrics, Team Performance and Team online hours.

General Metrics
- The General Metrics tab opens up by default when the user clicks on the Insight section. Data will populate below based on the date range selected at the top, which can be adjusted. You may also alter the "Timezone" with UTC being the default selection.

- The General Metrics tab provides valuable insights into Conversion Metrics, GMV, Visitor Metrics, and NPS Metrics.
-
Conversation Metrics
The Conversation Metrics section tracks user interactions across both text and video formats. It helps teams understand overall engagement trends and patterns through the following data points:
-
Total Conversations: Displays the complete count of all conversations, including both text chats and video calls.
-
Text-only Conversations: Represents the number of conversations that occurred exclusively over text, where both parties actively participated.
-
Video Chat Conversations: Represents the number of conversations that included a video call, where both parties actively participated.
-
Average Duration (minutes): Shows the average length of time a conversation lasted, measured from the first activity (text or call) to the last.
-
Conversation Breakdown Trend: Visualizes the trend of conversation types over time, comparing overall conversation volume to video interactions. It highlights shifts in user engagement formats.
-
Conversations by Intent and Sentiment: Offers deeper insights into user motivation and tone, helping teams understand the purpose and emotional context of interactions.

-
- The GMV section emphasizes the financial implications of conversations by measuring the Conversion Rate, which indicates the percentage of unique visitors who complete a purchase following a conversation. Additionally, it tracks the Number of Orders and Attributed GMV, which represents the total value of orders associated with two-way conversations. The Average Order Value (AOV) is calculated by averaging the order amounts, excluding shipping and taxes but including any discounts. This section also features trends for both Attributed GMV and the Number of Orders, providing valuable insights into sales performance over time.
- The Visitor metrics illustrate the effectiveness of the One-to-One widget by comparing unique visitors who see the widget to those who click on it. The Widget CTR trend shows daily changes in this click-through rate, helping to gauge how well the widget engages users. A rising CTR indicates increased interest, while a decline suggests a need for optimization.

-
Customer Satisfaction
This section includes the Average Rating, which reflects the mean of all Net Promoter Scores (NPS) submitted by visitors, regardless of whether the survey was fully completed or closed out. Additionally, the Average Rating Trend illustrates daily fluctuations in these ratings. The CSAT Rating Distribution presents a historical overview of ratings assigned to various agents, while the CSAT Feedback Detail provides in-depth insights into individual surveys, including specific ratings, agent names, and visitor feedback.
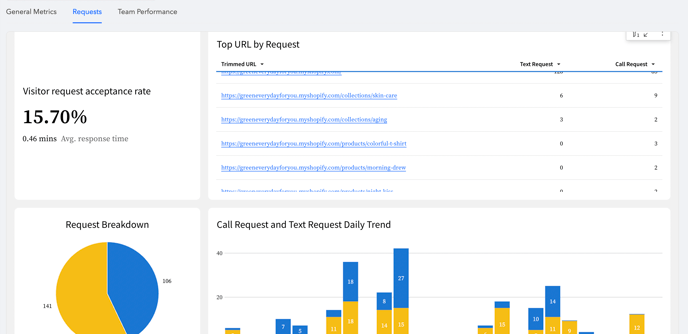
Requests
Team Performance
Agent Leaderboard
This dashboard tracks agent performance, including the Average Rating from Net Promoter Surveys, Agent Initiated Requests and their acceptance rates, Total Conversations, and Attributed Sales and Orders from conversations.

Performance Trends
This section illustrates the progression of each agent's performance over time, highlighting key trends such as the Average Rating Trend, Agent Initiated Request Trend, Acceptance Rate Trend for Agent Initiated Requests, and Total Conversation Trend.
The Agent Initiated Request Acceptance Rate Trend displays the overall trajectory of each agent's acceptance rate for requests they have initiated during the selected timeframe.
The Total Conversation Trend reflects the overall trajectory of the total number of conversations handled by each agent throughout the selected period.

Team online hours
In this section, you can view the current online status of the team, including the number of agents online and their daily online hours. It displays each agent's name, along with the time they first logged in and when they logged out for the day, as well as their current status.
Hovering a cursor over a box shows an option to enlarge the view. To export the dataset, click the three dots then select "Export".
To download a PDF view of the full report, click Export Report.

What Insight is Available to View?
For a detailed list of our One-to-One analytics and definitions, please view our One-to-One Virtual Shopping Analytics Glossary.