
Learn how to view GMV metrics performance comparisons in your dashboard.
Note: This is relevant if you are on our Pilot or Starter plans..
Navigate to the Performance Dashboard Section:
- Under Video, navigate to Insights.
- Under Short Videos, navigate to the Performance view.
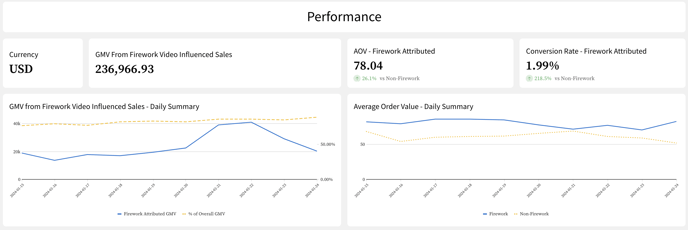
- In this view, you will see:
- Currency
- GMV from Firework Influenced Sales = Sales tracked from a user that viewed a Firework player / widget.
- Average Order Value (AOV) = Daily trend of Firework influenced AOV compared with non-Firework influenced AOV.
-
- Conversion Rate - Firework Influenced = Visitors who viewed the Firework video in interactable engaged mode and went ahead and made a purchase within 30 days. The uplift is measured against non-Firework conversion rate.
- Non-Firework conversion Rate = Visitors who browsed the website but never viewed the Firework player, and then went ahead and made a purchase within 30 days.
- GMV From Firework Video Influenced Sales (Daily Summary) = One trend line shows the actual GMV amount that is Firework influenced. The other trend line shows what % of overall GMV from that website.
- Conversion Rate - Firework Influenced = Visitors who viewed the Firework video in interactable engaged mode and went ahead and made a purchase within 30 days. The uplift is measured against non-Firework conversion rate.