When your livestream is complete, the Firework servers will start compiling your data into powerful insights for you to review. This process may take some time (up to 30 minutes).
To view your data analytics for a livestream event, navigate to your livestream event in the Firework Business Portal. Then, click the Analytics tab.
The first thing you will see under the title of your livestream event is the duration and start time of the livestream. Then, you’ll see a gray frame where you can view Cumulative metrics for the event in three time increments by selecting Last 7 days, Last 28 days, or Last 90 days in the drop-down menu. This shows you the duration of time viewers spent watching your livestream event and the number of viewers both live and in replay mode.
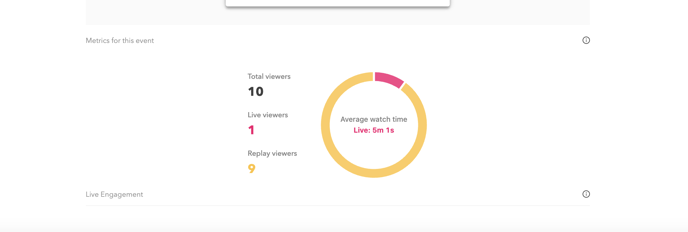
In the Metrics for this event frame, you’ll see a breakdown of viewers. This breakdown includes a count of all viewers who tuned-in live and those who watched the replay. This count includes viewers who watched the livestream up until 10 minutes before you began reviewing these analytics. On the left, you’ll see the total number of unique viewers as well as the number of unique live and replay viewers. Inside the circle, you’ll see the average watch time per unique viewer.
In the Live Engagement section, there is a stacked, smooth line chart which represents the engagement of the live viewers. Not every livestream event will have all of this data, as you may not have the required package or configuration necessary for viewers to add products to cart when clicking on the product cards. Hovering over the chart will show multiple engagement data for each minute of the livestream.
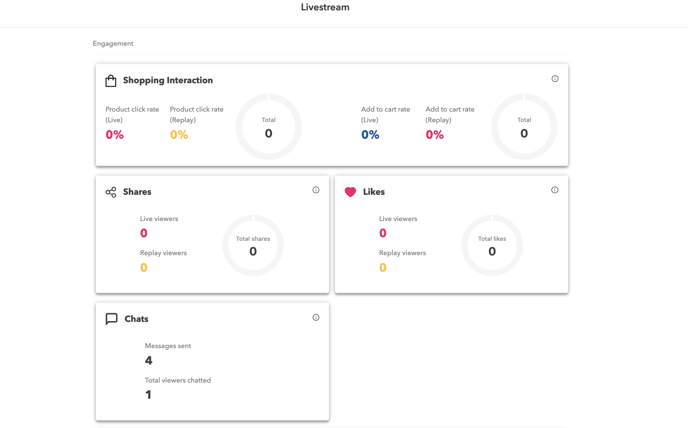
In the Engagement section, you’ll see additional engagement data broken down by live and replay viewers. This data includes:
- Shopping Interaction
- Product Click Rates - all unique viewers who clicked on a product card during your livestream at least once on a third-party site or on your website with no storefront integration
- Add to Cart Rates - all unique viewers who clicked to add a product to cart at least once if Add to Cart is enabled in your Firework account
- Shares - This is a count of how many times the livestream was shared by viewers; both live and in replay mode.
- Likes - This is an aggregate of how many times the heart button was clicked or pressed during your livestream event. This is not based on unique viewers; it’s the total number of times the livestream was “liked”.
- Chats - This is a count of how many chat messages were sent during the livestream and how many unique viewers sent at least one chat message.
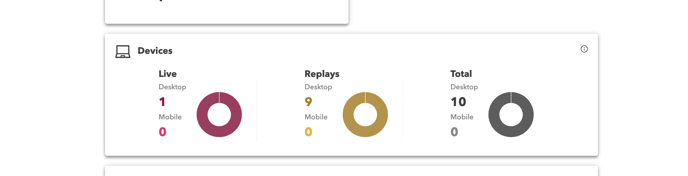
In the Devices section, you’ll see what Devices viewers watched your livestream event on both during the live stream and replay. The data breaks down which users were on mobile, desktop, or other devices.
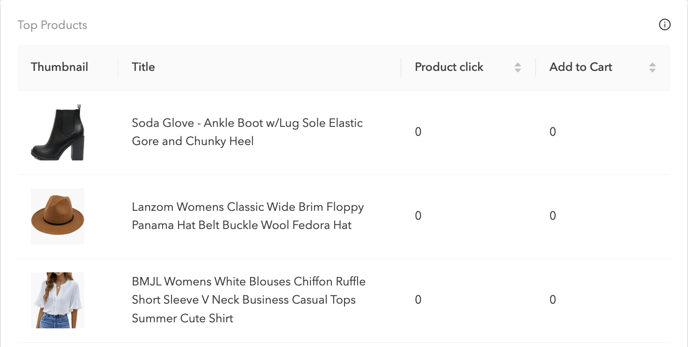
In the Top Products section, you’ll see a breakdown of all of the products that you featured in your livestream:
- Thumbnail - The image used in the product card for the product
- Title - The name of the product in your store
- Product Click - How many viewers clicked on the product
- Add to Cart - How many viewers added the product to the cart. (To see this data, you must have Add to Cart enabled on your account. If you are interested in this feature, please talk to your Partnership Success Manager.)
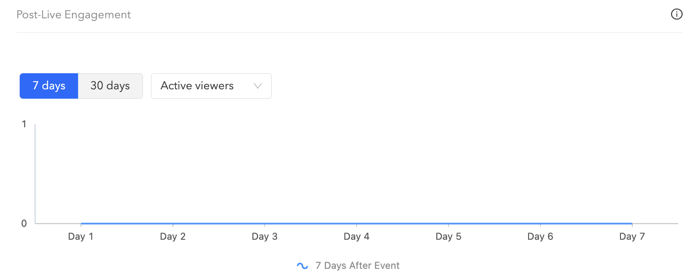
Finally, in the Post-Live Engagement section, you can use the custom chart to view the number of viewers, likes, and shares, and Add to Cart rates for viewers of your livestream replay. Select the categories in the drop-down menu and select the timeframe (either 7 days or 30 days).
Gathering More Analytics:
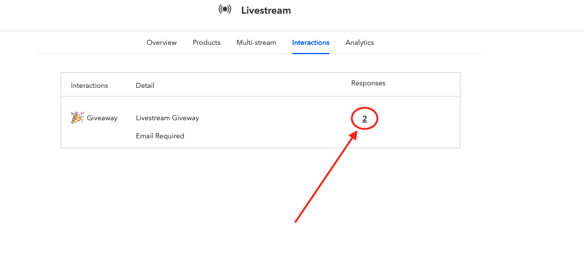
Analytics on Question Cards, Polls, and Giveaways will be available immediately.
To gather analytics on Question Cards/Polls/Giveaways, select the Interactions tab from the Showroom video. Emails from responders to the question cards and giveaways can be downloaded from the Business Portal by selecting the number of Responses to the Question.